Market Commentary: April 24, 2010: 2:30 am (PST). Posted by Manu Walia
We believe that perception drives markets. Obviously fundamental economic numbers and data carve the aggregate investor perception. Since August 2009, we have been in the camp of focusing on unemployment and 2010 corporate earnings.
Majority of US corporations who have announced earnings for Q1, 2010, have surprised investors and in addition have also raised expectations for the foreseeable future. In other words the perception of earnings robustness is still intact. That was our main point from the very beginning. As long as the US corporate communication is positive, we as investors will continue to fuel markets. For example, most regional banks have announced that their real estate portfolios are stabilizing and corporate loan delinquencies have if not diminished have improved. The truth and primarily the expectation of improving economic conditions have fueled the markets for the last thirteen months.
Recently, there has been a lot of political rhetoric to bring about financial reform in the areas that attributed to the recent collapse of the US financial infrastructure. The main endeavor is to somehow control activities within major financial services organizations, which catalyzed greed and in turn attributed to the system near collapse.
Why is it that we as a society spend tremendous amount of time on trying to justify events after they have happened and further try to solve the same problems in hind sight. Yes, there is some pertinence in putting controls in place or having specific rules of any game, but how can a capitalistic society get rid of the basic human instinct; Greed and Fear.
Without being philosophical, if we need to shape our society so that we as a group do better for the entire human race, we need to think a bit less for ourselves and more for the betterment of society. One would say that that is too vague and more so what that really means. We don’t believe that government intervention can truly make the radical changes we need in the continuum of society. We believe that the entire society needs to be nurtured in a different way than we have been accustomed to. The commonality between, Dalai Lama, Mother Teresa, Bill Gates and Warren Buffet is that they are all very wealthy individuals. Not necessarily wealthy from their wallets but from character. The commonality comes from being at a stage of self actualization. All of the above individuals have been in the state of giving their wealth to society in one way or another. They all come from different walks of life but have one common character: they were all at the point of self actualization when they started dedicating their lives to society.
Unfortunately, our society instills the need to accumulate material things as trophies to create a position in society. Instead of viewing micro sectors of society, our government should start to focus on the big picture and attempt to change the facet of the societal character. It is easy for me to say, but we can not solve this problem overnight. I don’t even think that we can solve it over decades, but we can sure try to be entrepreneurial for the betterment of the masses as opposed to a few individuals.
Market Commentary: April 14, 2010: 12:30 am (PST). Posted by Manu Walia
April 14 (Bloomberg) — The Federal Reserve said the economy expanded “somewhat” across most of the U.S. in March as consumer spending and manufacturing improved, signaling the recovery is broadening without gaining much speed.
April 14 (Bloomberg) — JPMorgan Chase & Co. said a “broad- based” economic recovery boosted first-quarter earnings 55 percent, surprising analysts with record fixed-income trading revenue and a better-than-expected outlook for consumer credit.
The most watched variables over the last few months have been the unemployment rate and the earnings expectations for corporate America. We have mentioned umpteen times that as long as the perception of earnings growth is intact we can expect the market to continue to grow. As mentioned from the earnings of JP Morgan, the banking behemoth, we can confidently project a better than expected Q1, 2010 earnings season.
If the earnings of the S&P 500 companies continue to show robustness, we can see the markets gains to be in the double digits over the next few months.
We however believe that the markets shall take a breather around the May-June time frame as the Federal government’s next move would be to prepare the markets for a rate hike. Despite the stabilizing economy and growth in corporate earnings, the major engine of US economic growth remains the retail consumer. Even if employment situation improves, higher productivity will continue to put pressure on wages and hence dampen consumption at some point.
Based on these assumptions, we believe that a wise investor will take advantage of the highest growth sectors domestically and internationally. These in our view would comprise of Financial, Technology and the Healthcare sector.
Market Commentary: April 8, 2010: 5:30 am (PST). Posted by Manu Walia
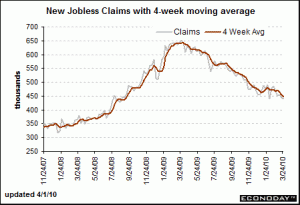
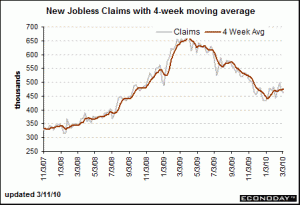
Our March 25th Market Commentary started out “Markets are worried about the employment picture with good reason. The economy goes as does the jobs scenario. It can be seen in the Chart below that the US jobless situation, even though on a downward slope since April, 2009 is experiencing an interim setback….”
460,000 people filed for the jobless claims for the week ending March 27. Expectations were lot lower at approximately 435,000.
We have observed and mentioned in the past that we believe in the turn around of the employment situation (See Chart 1 above). Even though most economists have attributed the recent upsurge in job creation to government intervention, we see a real turnaround in crucial areas like manufacturing and technology.
If in fact our assumptions and analysis is somewhat accurate, we should experience earnings growth and stabilization in the housing sector. If this happens, we believe that the banking sector will see a huge uptick in earnings for the next few quarters.
We would be buyers of select national and regional banks. In addition, we encourage investors to focus on technology and healthcare for long term capital appreciation.
Market Commentary: March 25th, 2010, 10:00 pm (PST). Posted by Manu Walia
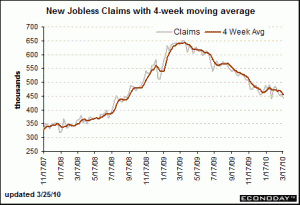
“Initial jobless claims fell to a lower-than-expected 442,000 in the March 20 week, which outside of a single week in the up-and-down month of February, is the lowest total of the recovery. Expectations were centered at 450,000. The four-week average, at 453,750, is at a cycle low.“
Source: www.bloomberg.com
It can be observed from Chart 1 above that the jobless claims, a measure of the unemployment situation has been trending downwards since the second quarter of 2009. Even though this variable is a lagging indicator, it is important to note the high unemployment is a deterrent to a smooth economic revival as the US economy is primarily consumer driven.
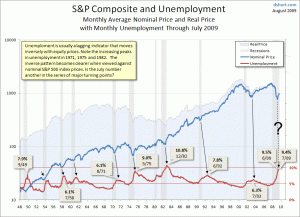
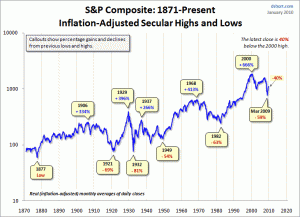
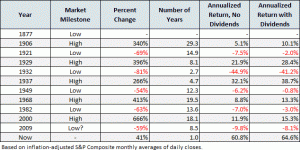
Currently, the unemployment rate is close to 9.8%, which is as high it was during the 1980s recession. After the market lost over 63% over a decade, it gained over 660% over the next 18 years (See below: Chart 2).
Source: www.dshort.com
In addition to the unemployment rate, US corporate earnings are crucial to maintain the market assent. We have mentioned before that the perception of earnings growth is more important to the market. April will be the beginning of the Q1, 2010 earnings season.
Most companies are expected to announce robust earnings and provide encouraging guidance. We believe that the Financial and Technology sector will benefit from a steep yield curve and global growth respectively. We are not fully convinced that the S&P 500 companies will earn over $85 in the year 2011 as some analysts have predicted. As the economy stabilizes, the US federal government will be compelled to raise rates which could dampen the overall margins and catalyze deceleration of overall earnings.
Market Commentary: March 17th, 2010, 2:00 pm (PST). Posted by Manu Walia
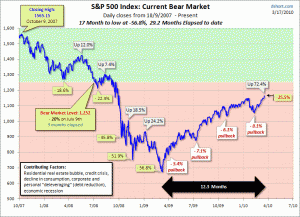
Source: www.dshort.com
Chart 1 above, clearly show how the S&P 500 (a gauge of US broad based markets) has made a V shaped recovery over the last 12 months (March 9th, 2009: Market Low). We would like to divert our reader’s attention to the period between October 2008 and the current time period (March 2010).
The value of the S&P 500 closed at 1,161 on October 1st, 2008, which is virtually the same as the value today. In other words, if an investor did not look at the markets for the last 18 months, he/she would say that the markets have been stagnant for that time period. We obviously know that that is not the case, and a lot happened during this tumultuous time.
Our endeavor is to show the importance of perception in the mind of an active investor. If we scroll down to March 11th, 2010’s market commentary, we observe a case for the S&P 500 with a potential to move in a range of 1,358-1,785. In other words, a return of 16% -53% on the lower to upper range respectively. What does this mean???
As the economy contracted, the media led by major research analysts and economists, started to lower the S&P 500 composites earnings projections. At one time, the 2009 earnings estimates had been lowered to $45. Actual earnings ended up being approximately $54-55, a 20% divergence from the lowest earnings estimate. Similarly, as the market sentiment has turned positive, some analysts are now expecting the S&P 500 companies to approximately $80-85 for the year 2011. Who is to say that this will come to fruition? The truth is that currently, investors are buying into this bullish case and continue to believe in the economic expansion, despite the high unemployment rate.
We have mentioned umpteen times in the past and continue to believe that investors should sell when they feel happy and buy when they feel queasy…enough said!!!
Market Commentary: March 11th, 2010, 10:00 am (PST). Posted by Manu Walia
“Jobless claims remain stubbornly high, pointing to continued slow bleeding for payrolls. Initial jobless claims totaled 462,000 in the March 6 week, about what was expected and driving up the four-week average by 5,000 to 475,500 for the highest level since November when claims first broke below 500,000. There won’t be much hope for payroll gains until claims move convincingly below 450,000.”
It is easy to view the market movement and believe that we are in a recovery phase. I guess it is easy to follow the trend and believe in it till the trend reverses. On the other hand, it is due to these types of self fulfilling prophesies that takes markets from one extreme to another.
As mentioned above and can be observed from Chart 1, the jobless claims have been disappointing over the last few weeks which put a damper on economic growth. On the other hand, most US corporations have benefited from cost cutting and retrenchments during the 2008-09 economic contraction. Due to this development, the earnings and projections from US corporations have been robust. We have now gone from $45-50 earnings for the S&P 500 companies to a range of $85-90 earnings for the year 2011. If we use the average Price Earnings ratio of (Ref: CGAM December 2008 Newsletter) last 25, 50 and 83 years respectively, we would infer the following valuation for the S&P 500:
- 25 year S&P 500 P/E average: 21.01 X $85 = 1,785
- 50 year S&P 500 P/E average: 17.71 X $85 = 1,505
- 83 year S&P 500 P/E average: 15.98 (1925-2008) = 1,358
If we believe in these assumptions, we can then value returns of 56%, 31% and 19% for the 25 year, 50 year and 83 year average P/Es respectively, with a 12-18 month time horizon. Once again, all these models are based on assumptions. We wanted to bring this to our reader’s attention to provide evidence of the herd mentality in the market we are proponents of. As the activity in the main street improves, most analysts start to raise their earnings estimates. There are two reasons for that. Firstly the overall economic activity is actually improving, but secondly, these analysts do not want to be left alone or be too far from the mean. In essence, this phenomenon continues till it reverses and it happens all over again on the downside.
We still believe that there is true recovery in the market, but increasing estimates and valuing major indexes is a fools errand. There are a lot of variables that can and will change between now and 2011. We believe that investors should continue to find major deviations in the market and invest gradually in the areas which they believe will show real growth over the foresseable future. With the risk of sounding like a broken record, we believe that global companies involved in the healthcare, technology and financial sector shall do particularly well as the basic demand in these areas should consistently grow over the next 5-10 years.
Market Commentary: March 2nd, 2010, 9:00 am (PST). Posted by Manu Walia
As markets move significantly in either direction, investors start to speculate and expectations of a reversal increase. We have now experienced more than 50% gains in major market indexes since the low of March 2009. In our February Newsletter we described the behavior of the broad based market indexes during a prolonged bullish period. Our belief that markets go through interim corrections during secular bullish phases was confirmed with the recent 7.5% correction.
Following is a chart that illustrates the movement of the S&P composite index since 1877 and our observations:
- Annualized growth rate since 1871 = 6.63% (Includes dividends).
- Since the first trough in 1877: Secular bull gains totaled 2075% for an average of 415%.
- Secular bear losses totaled -329% for an average of -65%.
- Secular bull years total 80 versus 52 for the bears, a 60:40 ratio.
One can infer from Table 1 below that we are currently at a point where markets are coming from a traumatic downturn not experienced in decades. Even though we have gained over 50% from the March 9, 2009 low, we could be only at the beginning of a major bullish phase if history is any indication of the future. Then again, this could be wishful thinking.
Obviously, with the US economy improving, market participants tend to exhibit positive or bullish sentiment, further fueling the economic recovery. This self fulfilling prophesy can not continue forever and at some point markets shall correct.
We believe that currently both, the US and international economies are on a recovery path, with the emergence of the global consumer, especially in Brazil, Russia, India and China; the BRIC countries. We believe that global companies involved in the healthcare, technology and financial sector shall do particularly well as the basic demand in these areas should consistently grow over the next 5-10 years.
Market Commentary: February 25th, 2010:9:00 am (PST). Posted by Manu Walia
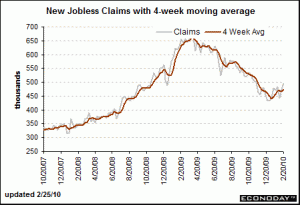
“The number of jobless filing for initial unemployment claims increased in February, pointing to trouble for the February employment report and sending equities and commodities lower in immediate reaction. Initial claims jumped to 496,000 in the Feb. 20 week, the highest level since November. The four-week average, up 6,000 to 473,750, is also the highest since November and is more than 15,000 higher than January levels. In an ominous note for the monthly jobs report, claims offices said heavy weather increased the number of claims in the week. Continuing claims, where data lags by a week, were slightly higher at 4.617 million and are little changed from January levels. The unemployment rate for insured workers is unchanged at 3.5 percent.”
Source: www.bloomberg.com
Markets are worried about the employment picture with good reason. The economy goes as does the jobs scenario. It can be seen in the Chart below that the US jobless situation, even though on a downward slope since April, 2009 is experiencing an interim setback. As mentioned above, initial jobless claims jumped in the third week of February. It is also important to notice that bad weather was also a contributing factor. On the other hand retail sales in recent weeks have picked up indicating resilience from the public which contributes to over 75% of the economy.
The markets are still approximately 28% below the 2007 high of 14,166. We should realize that the overall economy has picked up, evident from the strong fourth quarter growth of 5.7%. Even though a lot of that was attributable to the government stimulus, the after effect should come in terms of support in various sectors like banking and financial services and job growth in the infrastructure area.
We can understand the slow down in the ascent of the capital markets as investors digest policy changes and the political rhetoric. We as investors should not take our eye off of the overall growth which could be experienced from a higher pool of consumers which have been created through globalization and economic liberalization throughout the globe.
We still maintain our favorable bias in terms of the US and global economic growth and adding gradually to existing positions in the area of Finance, Technology and Healthcare.
Market Commentary: February 22nd, 2010:9:00 am (PST). Posted by Manu Walia
Our February 19th commentary started with the emphasis on the Federal government move on discount rates. “The most watched move from the Federal government has been the interest rate movement. Yesterday, Bernanke and company raised the discount rate (charged to major banks by the Federal Reserve) from 0.50% to 0.75%. The endeavor is to make banks start relying on deposits as opposed to government help. Even though the index futures reacted negatively, this is a clear indication from the Feds that the markets are in the mode of stabilizing.”
Even though we believe that this indicates Federal government’s confidence in the state of the US economy, it could very well be a tactic on Mr. Bernanke’s part to test the reaction of the markets. The discount rate is the rate charged by the Federal government to major banks for borrowing assets from the Fed window. In other words, the government is encouraging major banks to start gravitating towards regular market operations as the overall markets stabilize.
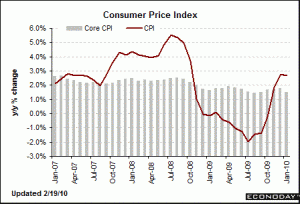
In addition, the consumer price index illustrated by Chart below, signify benign inflationary conditions which is another alleviating factor.
Source: www.bloomberg.com
We believe that the decision to raise the discount rates by .25% is a way for the Federal government to indicate that the markets are in the process of stabilizing and the vote of confidence in the future.
PLEASE REVIEW MARKET COMMENTARY ARCHIVED ON A MONTHLY BASIS
DISCLAIMER:
The data and analysis contained herein are provided “as is” and without warranty of any kind, either expressed or implied. Continuum Global Asset Management LLC (CGAM), any CGAM affiliates or employees, or any third party data provider, shall not have any liability for any loss sustained by anyone who has relied on the information contained in any CGAM publication. All opinions expressed herein are subject to change without notice, and you should always obtain current information and perform due diligence before trading. CGAM accounts that CGAM or its affiliated companies manage, or their respective shareholders, directors, officers and/or employees, may have long or short positions in the securities discussed herein and may purchase or sell such securities without notice. CGAM uses and has historically used various methods to evaluate investments which may, at times, produce contradictory recommendations with respect to the same securities. When evaluating the results of prior CGAM recommendations or CGAM performance rankings, one should also consider that CGAM may modify the methods it uses to evaluate investment opportunities from time to time, that model results do not impute or show the compounded adverse effect of transaction costs or management fees or reflect actual investment results, that other less successful recommendations made by CGAM are not included with these model performance reports, that some model results do not reflect actual historical recommendations, and that investment models are necessarily constructed with the benefit of hindsight. For this and for many other reasons, the performance of CGAM’s past recommendations and model results are not a guarantee of future results. The securities mentioned in this document may not be eligible for sale in some states or countries, nor be suitable for all types of investors; their value and income they produce may fluctuate and/or be adversely affected by exchange rates, interest rates or other factors. All of the views expressed in CGAM research reports accurately reflect the research analyst’s personal views regarding any and all of the subject securities or issuers. No part of any analyst compensation was, is, or will be, directly or indirectly, related to the specific recommendations or views expressed in a research report. Further distribution prohibited without prior permission. Copyright 2009 © Continuum Global Asset Management LLC. All rights reserved.

